

Mortgage Rates: Cost of Waiting vs. Buying Now
Mortgage Rates, Home Equity, Cost Of Waiting, Rising Home Prices, Rent Vs Buy, Financial Readiness
Waiting for 4.99% Mortgage Rates? Consider the Cost of Rent, Rising Prices, and Delayed Equity
If you are renting and watching Mortgage Rates, it is natural to hope for something that starts with a “4.” But waiting for a specific number like 4.99% is not financially neutral. While you wait, rent checks continue, home prices can change, and you delay the chance to build Home Equity. At the same time, buying before you are financially ready can create stress. This article from Northeast Financial LLC, NMLS #117273, walks through both sides so you can weigh the real Cost Of Waiting against what you can comfortably afford today.
Why Waiting for a Lower Rate Is Not Neutral
Many renters tell themselves, “I will buy when Mortgage Rates drop to 4.99%.” That sounds cautious, but it assumes that nothing else changes while you wait. In real life, several moving parts affect your long‑term finances:
You keep paying rent, month after month, instead of paying down a mortgage balance.
Home prices may rise, stay flat, or fall, changing how much house you can buy later.
You delay the chance to build Home Equity through principal payments and any potential appreciation.
At the same time, waiting can make sense if rent is much cheaper than owning, if your savings or credit need work, or if your job or location plans are uncertain. The goal is not to rush you into buying, but to show that “I’ll just wait for a better rate” has real financial trade‑offs that deserve a closer look.
📌 Key Takeaway: A lower interest rate in the future may come with higher rent paid, a higher purchase price, a larger down payment, and a later start on building equity.
Part 1: Comparing Price and Payment – Buy Now vs. Wait
Let us start with a simple example. Imagine a home with an original list price of $500,000. The list price is just an asking price, not proof of market value. Buyers and sellers negotiate, and actual value is ultimately tested through offers, appraisals, and the broader market.
Scenario A: Buy Now at a Discounted Price
Suppose you negotiate today and purchase the home below the list price, using a 30‑year fixed‑rate mortgage with 20% down at an illustrative rate of 7.125%. Here is how that looks:
Scenario | Key Details |
|---|---|
Buy Now at 7.125% | Purchase price: $470,000 (that is $30,000 below the original $500,000 list price) |
Wait, Pay More, Get 4.99% | Purchase price: $550,000 (that is $50,000 above the original list price) |
Wait Until Payment Break‑Even at 4.99% | Purchase price: ≈ $590,529 |
Notice what is happening. In the second scenario, you do get a lower monthly payment thanks to the lower Mortgage Rate. But that lower payment comes with a higher price, a larger down payment, and a bigger loan. In the third scenario, once the future price climbs to around $590,529, the monthly payment at 4.99% is about the same as buying today at 7.125% for $470,000. Under these assumptions, that payment break‑even point stays at about $590,529. Appreciation itself does not raise the break‑even; it just affects how quickly a real‑world purchase price might reach or pass that level.
💡 Pro Tip: When you focus only on the interest rate, it is easy to overlook how a higher price and larger loan can offset the benefit of a lower rate.
Part 2: What If Prices and Competition Both Increase?
Now let us look at a different hypothetical: what if you wait two years, rates do drop to 4.99%, but prices and competition heat up at the same time? Remember, this is just an illustration, not a prediction of Rising Home Prices or future bidding wars.
Start again with the same original asking price of $500,000. Assume:
The asking price increases at a hypothetical 4% per year for two years. That takes $500,000 to $540,800.
You decide to offer 10% above that future asking price to compete: $540,800 × 1.10 = $594,880.
With 20% down and a 30‑year fixed at 4.99%, here is how that looks:
Down payment (20%): $118,976
Loan amount: $475,904
Monthly principal and interest at 4.99%: ≈ $2,551.85
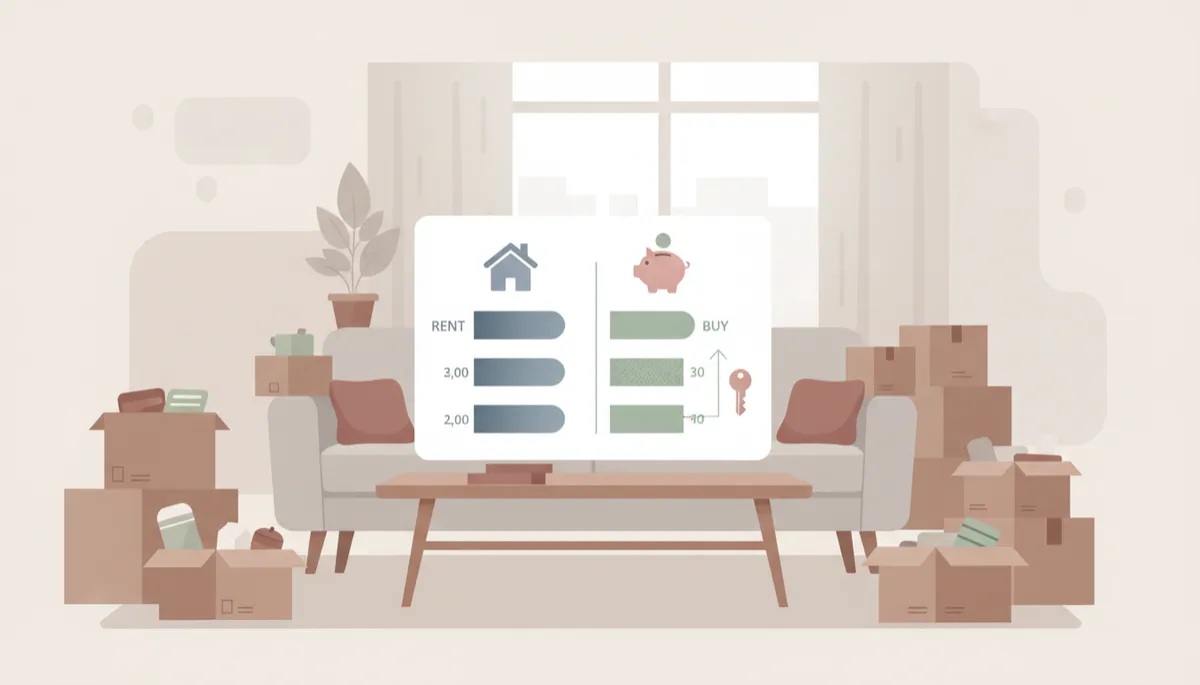
Even with a lower rate, higher prices and down payments can erase savings.
That monthly payment is about $18.67 more than buying today for $470,000 at 7.125%, and it requires $24,976 more for the down payment. This example shows how price increases and competition could wipe out a lower rate’s payment advantage. It does not say that 10% over list is typical, inevitable, or a minimum. It also does not claim that every drop in Mortgage Rates automatically triggers a bidding war. Markets vary by neighborhood and over time, and asking prices and offers do not automatically prove appraised value.
Part 3: What Happens During the Two Years of Waiting?
The Rent You Pay While You Wait
To keep things simple, let us use an illustrative rent of $2,500 per month. That is in line with many markets, where average rents often range from about $2,100–$2,300 per month, depending on city and property type. Your own rent may be higher or lower, so you should plug in your actual number.
$2,500 per month × 24 months = $60,000 in rent over two years.
Rent provides a roof over your head, flexibility, and sometimes lower responsibility for maintenance. It is not “wasted” in the sense that you receive housing in return. However, rent payments do not build ownership equity in that property. When you move out, you do not take any share of the building’s value with you.
Principal Reduction You Could Have Made
Now imagine instead that you had bought the $470,000 home with a $376,000 loan at 7.125%, making 24 scheduled payments during those same two years. Under those assumptions:
Remaining balance after 24 payments: ≈ $368,269
Principal repaid: ≈ $7,731
Mortgage interest paid in that time: ≈ $53,065
That $7,731 of principal reduction is part of your Home Equity. It is not investment profit; it is your own cash gradually moving from your bank account into ownership of the property by shrinking what you owe. The interest portion is the cost of borrowing, similar to how rent is the cost of using a property you do not own.
A Separate Illustration of Potential Appreciation
Next, consider a separate “what if” for potential appreciation over those same two years. Here we treat $470,000—the negotiated purchase price—as the starting market value. We are not assuming that the original $500,000 list price means you gained $30,000 of instant equity on day one.
At a hypothetical 4% annual appreciation, $470,000 grows to $508,352 after two years.
That is $38,352 of potential appreciation.
If we then add the ≈ $7,731 of principal reduction, you get about $46,083 of additional gross equity beyond your original down payment. Including your initial $94,000 down payment, total gross equity in this hypothetical would be around $140,083 after two years.
📌 Key Takeaway: Under this appreciation scenario, a buyer who waits would miss the opportunity to accumulate approximately $46,083 in additional home equity during those two years while also paying $60,000 for rental housing. Those figures describe different parts of the comparison; they cannot simply be added together and called a $106,083 loss.
Sensitivity: What If Prices Are Flat or Fall?
Appreciation is never guaranteed. Recent national data show that price growth has cooled sharply, with some months even showing slight declines. So it is important to see how different price paths affect the equity picture:
0% appreciation: If values are flat, equity growth over two years comes mainly from the ≈ $7,731 of principal reduction. You still build ownership, but more slowly.
4% annual appreciation: You add about $38,352 in potential price gains plus ≈ $7,731 in principal reduction, for ≈ $46,083 of additional gross equity beyond your down payment.
Declining prices: If values fall, the drop can offset or even outweigh your principal reduction, shrinking your original equity. This is one reason Financial Readiness and a long‑enough time horizon matter so much.
Part 4: Keeping the Wealth Comparison Fair
Three Different Concepts: Cash Flow, Equity, Net Worth
To make a fair Rent Vs Buy comparison, it helps to separate three ideas that often get mixed together:
Monthly cash flow: What leaves your bank account each month for housing—rent, or mortgage principal and interest plus property taxes, homeowners insurance, HOA dues, and maintenance.
Home equity accumulated: Your ownership stake, which comes from your down payment, principal reduction, and any change in the property’s value.
Overall net worth: Everything you own minus everything you owe, including home equity, savings, investments, and debts.
A true net‑worth comparison between buying now and waiting two years must look beyond the mortgage payment alone. It should account for:
Total ownership costs: mortgage interest, property taxes, insurance, HOA dues, maintenance, and closing costs when you buy and eventually sell.
The renter keeping and potentially investing money that would otherwise go toward the down payment and closing costs.
Any difference between total monthly rent and total monthly ownership costs—and whether that difference is saved, invested, or simply spent.
How long you expect to own the home and how home values change over that period.
Importantly, you should not count your down payment as newly created wealth—it is money you already had, just moved into a different asset. You also should not treat mortgage principal as both an expense lost forever and equity gained. And you should not add rent paid, appreciation missed, principal reduction, and a higher future purchase price into one giant “Cost Of Waiting” number; that would mix different measures and risk double‑counting the same effect.
📌 Key Takeaway: The question is not “Does buying always beat renting?” It is “Given my rent, savings, time horizon, and local market, which path is likely to support my long‑term net worth and peace of mind?”
Part 5: Refinancing and True Buyer Readiness
Buying Now With an Eye on Future Refinancing
One reason some buyers move forward even when Mortgage Rates feel high is the possibility of refinancing later. If you buy a home you can comfortably afford today and rates drop in the future, you may be able to refinance to a lower rate and payment, as long as you and the property qualify at that time.
Refinancing is never guaranteed. It depends on future income, credit, home value, loan guidelines, and market conditions.
Refinancing has costs, such as closing fees and possibly a new appraisal, which must be weighed against the potential monthly savings.
A new 30‑year term can lower your payment but may increase total interest paid over the life of your loans.
Refinancing should be viewed as a potential bonus, not the main reason to stretch for a home that is not truly affordable today. A mortgage you can barely manage at today’s rate will still feel tight, even if you hope to refinance later.
When Waiting May Be the Better Financial Move
While this article highlights the opportunity cost of delaying Home Equity, there are real situations where waiting is the smarter choice for your Financial Readiness:
Your rent is substantially lower than the full cost of owning a comparable home, and you are using the savings to build an emergency fund or pay down high‑interest debt.
You need time to strengthen your credit, increase savings for a down payment and reserves, or stabilize your employment or income.
You expect to move again within a short period, making it hard to recover transaction costs such as closing fees and potential real‑estate commissions.
Local market data and your own risk tolerance point toward the possibility of declining prices in the areas you are considering.
Renting is not a failure. It is one valid housing choice. The key is to be intentional: if you decide to wait, know what you are doing with the time and money you are not yet putting into a home purchase.
Bringing It All Together: What Are You Really Waiting For?
The examples in this article use a 24‑month waiting period, a current rent of $2,500 per month, 30‑year fixed‑rate mortgages with 20% down, and illustrative rates of 7.125% and 4.99%. They show that waiting for a specific Mortgage Rate often means:
Continuing to pay rent instead of paying down a mortgage balance.
Facing the risk of Rising Home Prices, higher down payment needs, and larger mortgage balances later.
Delaying the start of any Home Equity you might build through principal reduction and potential appreciation.
At the same time, the numbers remind us that buying is not automatically better. A home should fit your budget, your savings, your job plans, and your life. A lower future rate might reduce your monthly payment, but it may also come with a higher price tag and a larger check at closing. The Cost Of Waiting is real, but so is the cost of buying before you are ready.
📌 Final Thought: The right question is not just “What rate am I waiting for?” It is “What could waiting cost me—and what can I comfortably afford today?”
Next Step: Talk Through Your Own Numbers With Northeast Financial
Every household’s situation is different. Your rent may be higher or lower than $2,500. Your savings, income stability, credit profile, and local market conditions will all affect whether buying now, waiting, or setting a specific timeline makes the most sense for you. A Northeast Financial loan officer can help you compare:
Your actual rent versus a realistic range of ownership costs, including property taxes, insurance, and HOA dues where applicable.
Different down payment options and how they affect your monthly payment and Home Equity growth.
Local price trends and how a 24‑month “wait and see” approach might change what you can buy later.
Together, you can build side‑by‑side scenarios that reflect your real numbers, not just national averages or headlines about Mortgage Rates. That way, you are not simply waiting for 4.99% because it sounds good—you are making a clear, informed choice about your housing, your Home Equity, and your long‑term Financial Readiness.
Important Disclaimer
Hypothetical examples for informational purposes only. Rates shown are illustrative interest rates, not APRs or offers of financing. Mortgage payments shown include principal and interest only and exclude property taxes, homeowners insurance, HOA dues, and closing costs. Appreciation, future rates, and refinancing are not guaranteed. Actual rates, APRs, costs, and eligibility vary. All loans are subject to final underwriting approval. This is not a commitment to lend. Northeast Financial LLC | NMLS #117273.


